
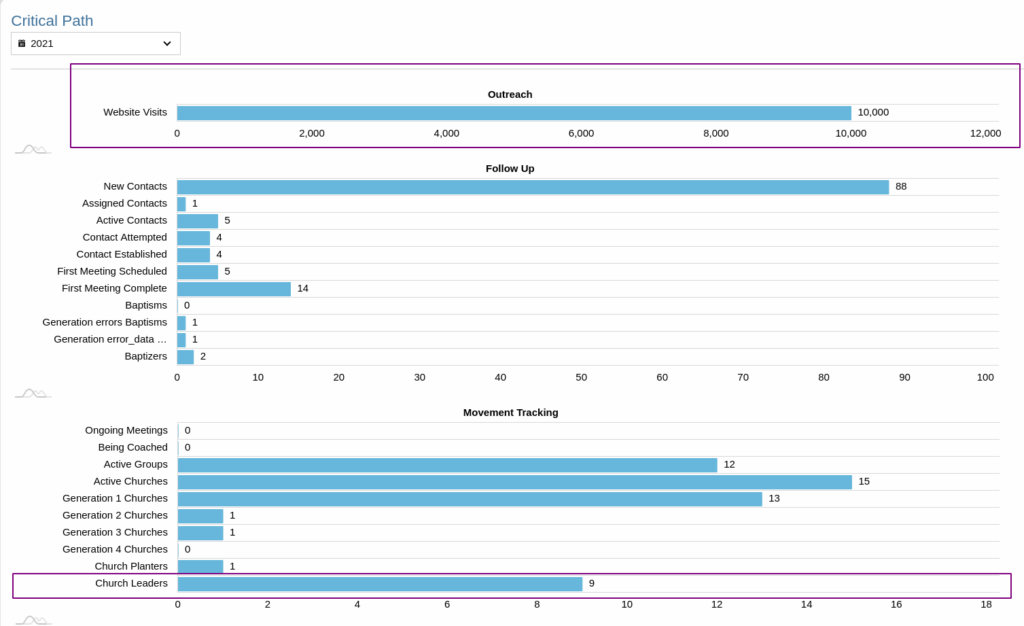
Add extra rows to the critical path chart. The numbers are added manually.
How to access:
- Access the admin backend by clicking on the
 on the top right and then click
 Admin. - In the left hand column, select
Reports (DT).
 on the top right and then click
Creating fields to track #
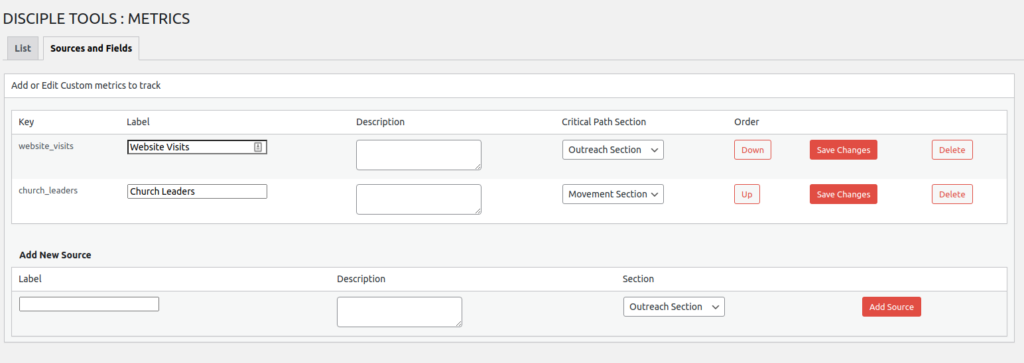
Click the Sources and Fields Tab.
Under Add new source, fill out the Label, Description and Section. Outreach section is a the top of the critical path, Movement section is at the bottom. Click Add Source.
Here we have created 2 custom metrics to track, Website Visits and Church Leaders:
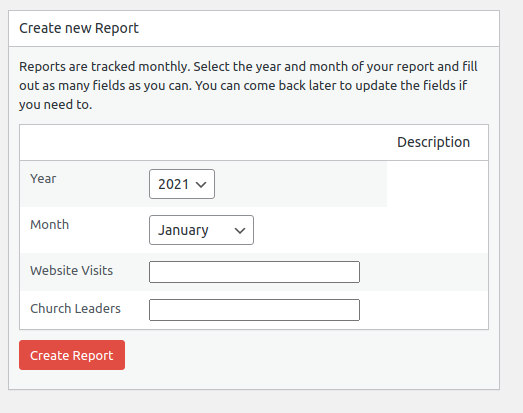
Create the Report #
Under the list tab click the Create New Report Button. The report with hold all the numbers for a specific month. Fill out the Year, Month and the fields you just created:
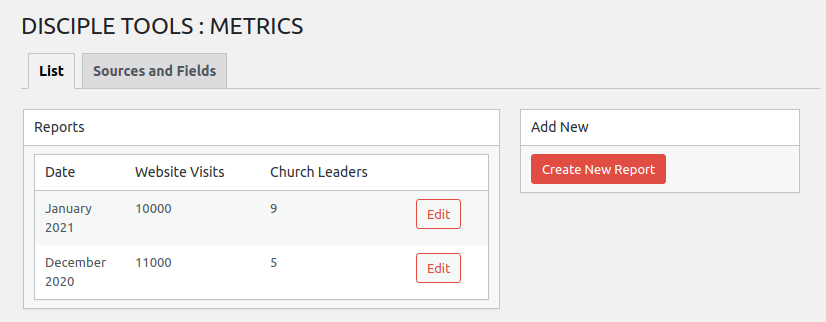
The list view will show each month. Click Edit on one of the rows if you need to change the numbers or add any.
The critical path will then look like the image at the top if this page.